A few months ago, Vertiver facilitated a bi-lateral dialogue
on cancer for CRUK (Cancer Research UK) and DBT
(Department of Biotechnology, GoI). The Affordable
Approaches to Cancer Summit converged sixty cancer
experts from across both countries representing 40 research
institutions working on various aspects of cancer.
To set the context for the two-day dialogue, we dove into
research to understand the face of cancer in both countries.
The discrepancies and similarities in cancer trends across
both countries brought forth the need to present research
data in an engaging and concise manner.
We began by collating information from news articles and
whitepapers soon turning to medical journals and research
papers. The data we came across was immense and its
reliability critical. As we began to fill the repository of data,
the numbers validated the grim scenario of cancer and
the urgent need to tackle it through collaborative research.
The shift from words and numbers to visuals is not
just a form of truth telling but also a form of aesthetic
storytelling. Our goal was to engage a multi-stakeholder
audience across biologists, clinicians, researchers, policy
makers, and NGOs through a catchy and attractive data
narrative.
We translated data into scale graphs, pictograms,
illustrations, and color separated categories adding labels
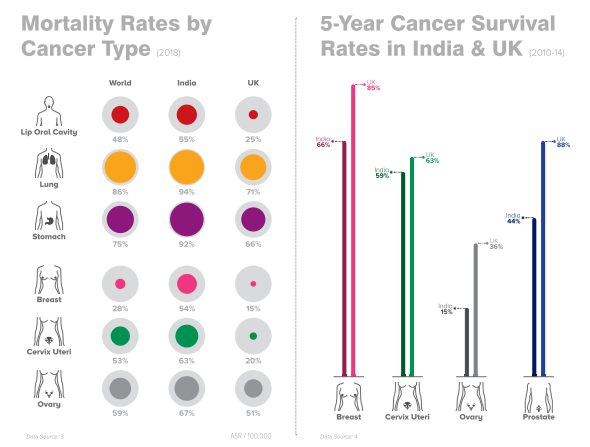
and descriptions to the visual narrative. We juxtaposed India
and UK data to highlight the major difference in the way both
countries experience and tackle different cancers.
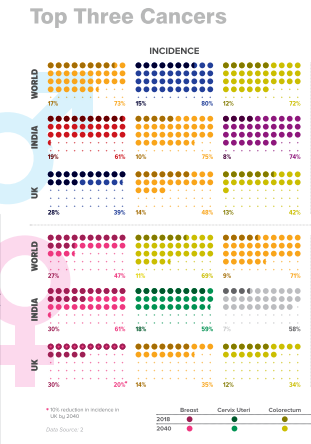
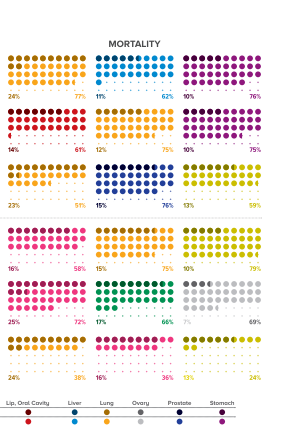
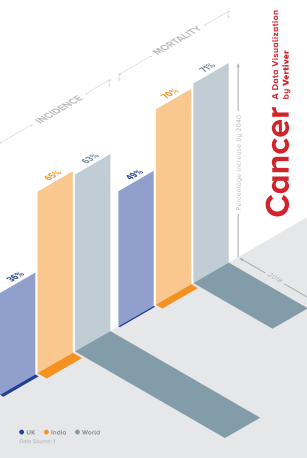
This work led to a new data visualization that compares
cancer across mortality and incidence not just in India but
also as a subset of the world data. As always, our iterative
design and research process required multiple prototyping
along the way. The meeting point of graphic design and
quantitative analysis revealed surprising insights:
mortality in cancer would more than double in both
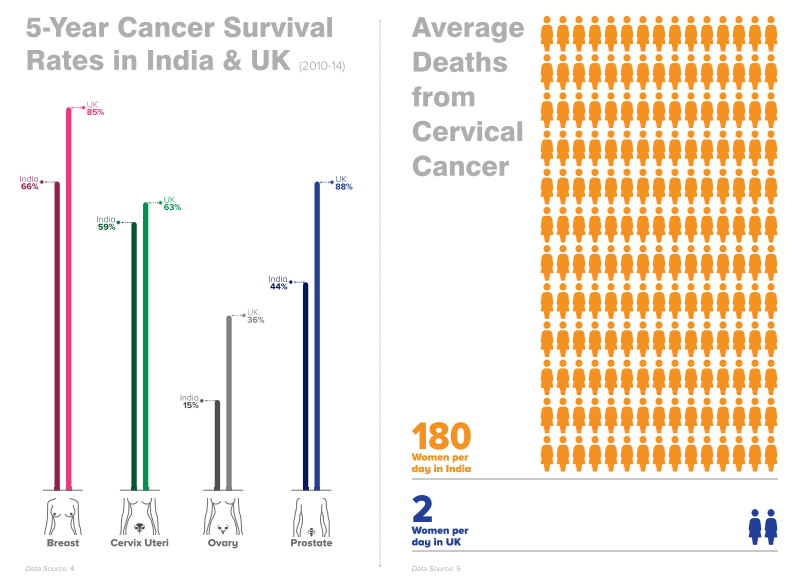
India and UK by 2040, cervical cancers kills an average
of 2 people per day in the UK while in India it kills 180(!!),
breast cancer mortality in India is three times that of the UK!
As a team of visual storytellers, it is always a privilege for
us to aid decision makers and researchers navigate the
complexity of sustainability issues. Health has increasingly
become a direct outcome of changes in the environment
and we hope that our visualization provides an easy data
reference for experts working towards research solutions.
Recent Comments